Executive Summary
The Modular Lightweight Sustainable Building Units manufacturing plant project in the industrial and manufacturing sector in Qatar targets a promising market opportunity. With an investment of ٨٬٥٠٠٬٠٠٠ QAR, it achieves a Net Present Value (NPV) of ٦٬٠٦٩٬٦٥٩ QAR, an Internal Rate of Return (IRR) of ٣٦٪, and a payback period of 2.3 years.
| Indicator | Value |
|---|---|
| Initial Investment | ٨٬٥٠٠٬٠٠٠ QAR |
| First Year Revenue | ١٢٬٠٠٠٬٠٠٠ QAR |
| Annual Growth (CAGR) | ١٠٪ |
| Net Margin (Y1) | ١٤٪ |
| Return on Investment (Avg.) | ٢٩٪ Annually |
| Net Present Value (NPV) | ٦٬٠٦٩٬٦٥٩ QAR |
| Internal Rate of Return (IRR) | ٣٦٪ |
| Profitability Index (PI) | ٢ |
| Payback Period | ٢ years |
| Breakeven Year | Year ٣ |
| Expected NPV (Probability-Weighted) | ٦٬٢٠٩٬٢٢٨ QAR |
Assumptions and Basis
The figures in this study are based on project data, the nature of the industrial and manufacturing sector in Qatar, and local market indicators, according to the following assumptions:
| Assumption | Value |
|---|---|
| Initial Capital | ٨٬٥٠٠٬٠٠٠ QAR |
| First Year Revenue | ١٢٬٠٠٠٬٠٠٠ QAR |
| Annual Growth | ١٠٪ |
| Cost of Goods Sold (COGS) | ٤٠٪ of Revenue |
| Operating Expenses | ٣٠٪ of Revenue |
| Tax/Zakat | ١٠٪ |
| Discount Rate (WACC) | ١٢٪ |
| Study Horizon | ٥ years |
Basis of Assumptions: Raw material prices and labor costs in Qatar
Project Description and Opportunity
The project involves establishing a factory for manufacturing lightweight and sustainable modular building units in Qatar, with a focus on meeting the needs of the local construction market.
Market Study and Demand
The construction market in Qatar is considered a fast-growing market, with increasing demand for residential and commercial units.
Market Sizing (TAM / SAM / SOM)
Market size was estimated using market analysis methodology and current trends.
| Level | Annual Size | Description |
|---|---|---|
| TAM — Total Addressable Market | 500.0 Million QAR | Total serviceable demand |
| SAM — Serviceable Available Market | 200.0 Million QAR | The segment your model reaches |
| SOM — Serviceable Obtainable Market | 100.0 Million QAR | Your realistic early share |
Sizing Basis: Qatar construction market
Unit Economics
Measures the profitability of each sales unit/customer — the most accurate feasibility indicator:
| Unit Indicator | Value |
|---|---|
| Sales Unit | Modular Building Unit |
| Avg. Price/Revenue per Unit | ٥٠٬٠٠٠ QAR |
| Customer Acquisition Cost (CAC) | ١٠٬٠٠٠ QAR |
| Customer Lifetime Value (LTV) | ٢٠٠٬٠٠٠ QAR |
| LTV/CAC Ratio | ٢٠× (Healthy) |
| Contribution Margin | ٣٠٪ |
Competitive Analysis
Competition in the construction market in Qatar is high, but the project relies on offering high-quality products at competitive prices.
Market Entry and Pricing Strategy
The market entry strategy includes marketing through social media and participating in trade exhibitions.
Capacity and Operations
The factory's production capacity is 1000 building units per year, with the possibility of expanding to 2000 units in the next two years.
Daily operations of the factory will be managed by a team of professionals, with a focus on meeting customer needs.
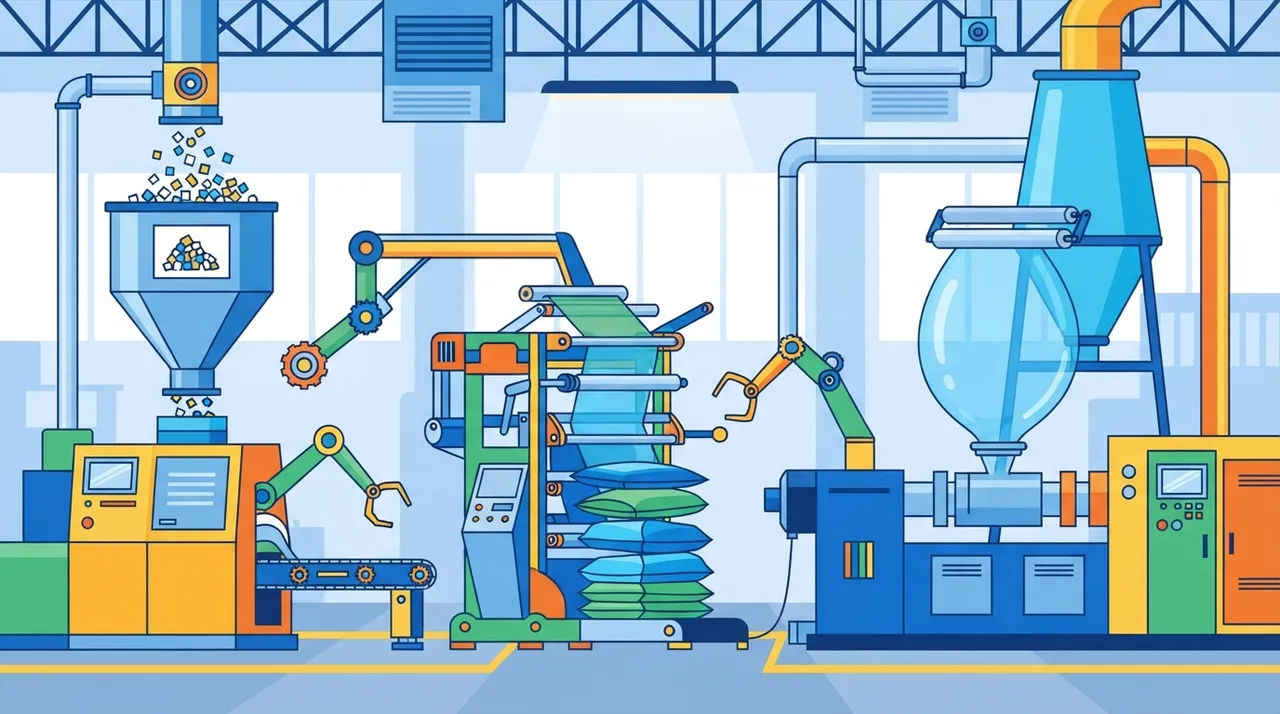
The factory will be equipped with modern and advanced machinery, with a focus on cost reduction and efficiency increase.
Projected Income Statement (5 Years)
| Item \ Year | Y1 | Y2 | Y3 | Y4 | Y5 |
|---|---|---|---|---|---|
| Revenues | ١٢٬٠٠٠٬٠٠٠ QAR | ١٣٬٢٠٠٬٠٠٠ QAR | ١٤٬٥٢٠٬٠٠٠ QAR | ١٥٬٩٧٢٬٠٠٠ QAR | ١٧٬٥٦٩٬٢٠٠ QAR |
| Cost of Sales | (٤٬٨٠٠٬٠٠٠ QAR) | (٥٬٢٨٠٬٠٠٠ QAR) | (٥٬٨٠٨٬٠٠٠ QAR) | (٦٬٣٨٨٬٨٠٠ QAR) | (٧٬٠٢٧٬٦٨٠ QAR) |
| Gross Profit | ٧٬٢٠٠٬٠٠٠ QAR | ٧٬٩٢٠٬٠٠٠ QAR | ٨٬٧١٢٬٠٠٠ QAR | ٩٬٥٨٣٬٢٠٠ QAR | ١٠٬٥٤١٬٥٢٠ QAR |
| Operating Expenses | (٣٬٦٠٠٬٠٠٠ QAR) | (٣٬٩٦٠٬٠٠٠ QAR) | (٤٬٣٥٦٬٠٠٠ QAR) | (٤٬٧٩١٬٦٠٠ QAR) | (٥٬٢٧٠٬٧٦٠ QAR) |
| EBITDA | ٣٬٦٠٠٬٠٠٠ QAR | ٣٬٩٦٠٬٠٠٠ QAR | ٤٬٣٥٦٬٠٠٠ QAR | ٤٬٧٩١٬٦٠٠ QAR | ٥٬٢٧٠٬٧٦٠ QAR |
| Tax | (١٩٠٬٠٠٠ QAR) | (٢٢٦٬٠٠٠ QAR) | (٢٦٥٬٦٠٠ QAR) | (٣٠٩٬١٦٠ QAR) | (٣٥٧٬٠٧٦ QAR) |
| Net Profit | ١٬٧١٠٬٠٠٠ QAR | ٢٬٠٣٤٬٠٠٠ QAR | ٢٬٣٩٠٬٤٠٠ QAR | ٢٬٧٨٢٬٤٤٠ QAR | ٣٬٢١٣٬٦٨٤ QAR |
| Net Margin | ١٤٪ | ١٥٪ | ١٧٪ | ١٧٪ | ١٨٪ |
Investment Cost Structure
| Item | Cost | Percentage |
|---|---|---|
| Raw Material Cost | ٢٬٥٥٠٬٠٠٠ QAR | ٣٠٪ |
| Labor Cost | ١٬٧٠٠٬٠٠٠ QAR | ٢٠٪ |
| Machinery and Equipment Cost | ١٬٢٧٥٬٠٠٠ QAR | ١٥٪ |
| Marketing and Advertising Cost | ٨٥٠٬٠٠٠ QAR | ١٠٪ |
| Management and Operating Cost | ٢٬١٢٥٬٠٠٠ QAR | ٢٥٪ |
Cash Flow and Breakeven Point
| Year | Operating Cash Flow | Cumulative Cash Flow |
|---|---|---|
| Year ١ | ٣٬٤١٠٬٠٠٠ QAR | -٥٬٠٩٠٬٠٠٠ QAR |
| Year ٢ | ٣٬٧٣٤٬٠٠٠ QAR | -١٬٣٥٦٬٠٠٠ QAR |
| Year ٣ | ٤٬٠٩٠٬٤٠٠ QAR | ٢٬٧٣٤٬٤٠٠ QAR |
| Year ٤ | ٤٬٤٨٢٬٤٤٠ QAR | ٧٬٢١٦٬٨٤٠ QAR |
| Year ٥ | ٤٬٩١٣٬٦٨٤ QAR | ١٢٬١٣٠٬٥٢٤ QAR |
Estimated breakeven point at annual revenue ≈ ٨٬٨٣٣٬٣٣٣ QAR (~٧٤٪ of first year revenue), with a contribution margin of ٦٠٪. Cumulative cash breakeven in Year ٣.
Funding Structure
| Funding Source | Percentage | Amount |
|---|---|---|
| Equity | ٦٠٪ | ٥٬١٠٠٬٠٠٠ QAR |
| Debt Financing (8% interest) | ٤٠٪ | ٣٬٤٠٠٬٠٠٠ QAR |
Sensitivity Analysis (Revenue × Operations)
The impact of changes in revenue and costs together on Net Present Value:
| Revenue \ Operations | −10٪ | −5٪ | Base | +5٪ | +10٪ |
|---|---|---|---|---|---|
| −20٪ | ٧٬٠٠٠٬١١٥ QAR | ٥٬١٣٩٬٢٠٢ QAR | ٣٬٢٧٨٬٢٨٩ QAR | ١٬٤١٧٬٣٧٦ QAR | -٤٤٣٬٥٣٦ QAR |
| −10٪ | ٨٬٨٦١٬٠٢٨ QAR | ٦٬٧٦٧٬٥٠١ QAR | ٤٬٦٧٣٬٩٧٤ QAR | ٢٬٥٨٠٬٤٤٧ QAR | ٤٨٦٬٩٢٠ QAR |
| Base | ١٠٬٧٢١٬٩٤١ QAR | ٨٬٣٩٥٬٨٠٠ QAR | ٦٬٠٦٩٬٦٥٩ QAR | ٣٬٧٤٣٬٥١٨ QAR | ١٬٤١٧٬٣٧٦ QAR |
| +10٪ | ١٢٬٥٨٢٬٨٥٤ QAR | ١٠٬٠٢٤٬٠٩٩ QAR | ٧٬٤٦٥٬٣٤٣ QAR | ٤٬٩٠٦٬٥٨٨ QAR | ٢٬٣٤٧٬٨٣٣ QAR |
| +20٪ | ١٤٬٤٤٣٬٧٦٧ QAR | ١١٬٦٥٢٬٣٩٧ QAR | ٨٬٨٦١٬٠٢٨ QAR | ٦٬٠٦٩٬٦٥٩ QAR | ٣٬٢٧٨٬٢٨٩ QAR |
Scenario Analysis
| Scenario | Probability | NPV | Assessment |
|---|---|---|---|
| Pessimistic | ٢٥٪ | ٢٬١٦١٬٧٤٢ QAR | Feasible |
| Base | ٥٠٪ | ٦٬٠٦٩٬٦٥٩ QAR | Feasible |
| Optimistic | ٢٥٪ | ١٠٬٥٣٥٬٨٥٠ QAR | Feasible |
Expected Present Value (Weighted): ٦٬٢٠٩٬٢٢٨ QAR.
Risk Analysis and Management
| Risk | Probability | Impact | Mitigation |
|---|---|---|---|
| Environmental Risks | Low | High | Reduce environmental impact |
| Financial Risks | Medium | High | Reduce costs and increase revenues |
| Operational Risks | Low | Low | Reduce costs and increase efficiency |
| Political Risks | Low | High | Reduce political impact |
Organizational Structure and Team
The project's organizational structure includes a management team, a manufacturing team, and a sales team.
Legal and Regulatory Aspects
The project will be managed in accordance with laws and regulations in Qatar, with a focus on compliance with environmental and operational laws.
Expansion and Sustainability Plan
Expansion plans include increasing production capacity, expanding product range, and entering new markets.
Environmental, Social, and Governance (ESG) Impact
The project relies on offering sustainable products, with a focus on reducing environmental impact.
Conclusions and Recommendations
The conclusion is that the project is considered a profitable project, with potential for growth and market expansion.
Frequently Asked Questions
How much does it cost to set up a modular lightweight sustainable building units factory in Qatar?
8.5 Million Qatari Riyals
How much does the project earn in the first year?
12 Million Qatari Riyals
What is the project's annual growth?
10%
Is the modular lightweight sustainable building units project profitable in Qatar?
Yes
What are the main risks of the project?
Environmental, financial, operational, and political risks
Sources and Disclaimer
- Qatar construction market
- International Development Organization
- Qatar Chamber of Commerce and Industry
Disclaimer: This is a guiding study that provides a financial analysis according to approved industry standards; verify the figures locally according to your project's reality before any investment decision.