Executive Summary
The Burger Restaurant project in the restaurant and food sector in the United States targets a promising market opportunity. With an investment of $350,000, it achieves a net present value of $56,716, an internal rate of return of 16%, and a payback period of 3.4 years.
| Indicator | Value |
|---|---|
| Initial Investment | $٣٥٠٬٠٠٠ |
| First Year Revenue | $٨٠٠٬٠٠٠ |
| Annual Growth (CAGR) | ٥٪ |
| Net Margin (Y1) | ٤٪ |
| Return on Investment (Avg.) | ١١٪ annually |
| Net Present Value (NPV) | $٥٦٬٧١٦ |
| Internal Rate of Return (IRR) | ١٦٪ |
| Profitability Index (PI) | ١ |
| Payback Period | ٣ years |
| Breakeven Year | Year ٤ |
| Expected NPV (Probability-Weighted) | $٦٩٬٧٥٩ |
Assumptions and Basis
The figures in this study are based on project data, the nature of the restaurant and food sector in the United States, and local market indicators, according to the following assumptions:
| Assumption | Value |
|---|---|
| Initial Capital | $٣٥٠٬٠٠٠ |
| First Year Revenue | $٨٠٠٬٠٠٠ |
| Annual Growth | ٥٪ |
| Cost of Goods Sold (COGS) | ٣٢٪ of Revenue |
| Operating Expenses | ٥٥٪ of Revenue |
| Tax/Zakat | ١٥٪ |
| Discount Rate (WACC) | ١٠٪ |
| Study Horizon | ٥ years |
Basis of Assumptions: The figures are based on the average costs and operations of independent burger restaurants in the United States for 2026, taking into account the average profit margin and growth in the fast-food sector.
Project Description and Opportunity
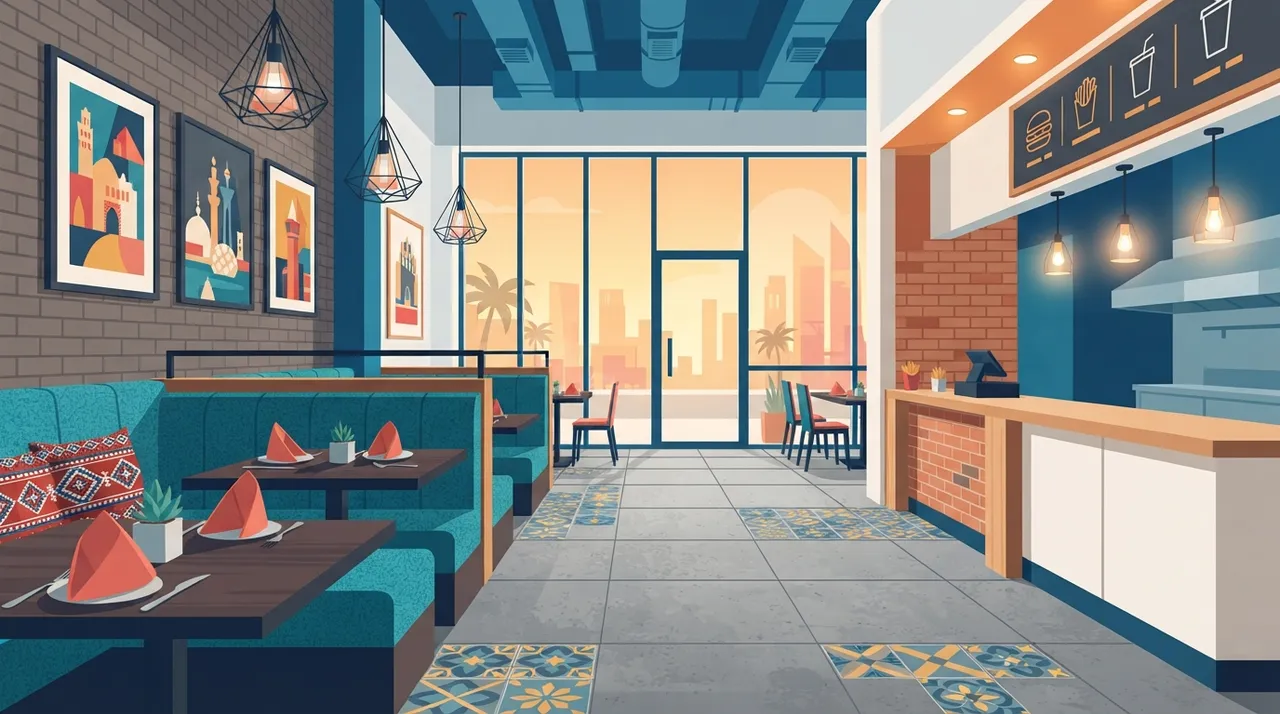
This burger restaurant project aims to offer a unique dining experience in the competitive US market, focusing on high-quality ingredients, innovative flavors, and excellent service. The restaurant targets customers seeking delicious and quick-to-prepare burger meals, with healthy and vegetarian options to cater to diverse tastes. The business model relies on a mix of dine-in, takeout, and delivery services to maximize customer reach.
Market and Demand Study
The fast-food market in the United States is experiencing continuous growth, with an estimated value of $390.13 billion in 2026, and is expected to reach $538.03 billion by 2034, at a compound annual growth rate of 4.1%. The burger segment represents a significant portion of this market, with a strong preference for convenience, value, and menu innovation. The market is also influenced by the increasing reliance on digital technology and delivery platforms, which enhances operational efficiency and expands the reach of restaurants.
Market Sizing (TAM / SAM / SOM)
Market sizing was conducted based on estimates of the fast-food and burger market size in the United States for 2026. The Total Addressable Market (TAM) includes the overall fast-food market, while the Serviceable Available Market (SAM) represents the burger segment within this market. The Serviceable Obtainable Market (SOM) was defined as a small percentage of the available market, considering the restaurant's operational capacity and local market competition.
| Level | Annual Size | Description |
|---|---|---|
| TAM — Total Addressable Market | $٣٩٠١٣٠.٠ million | Total serviceable demand |
| SAM — Serviceable Available Market | $٢٢٣٤٢٠.٠ million | The portion reachable by your model |
| SOM — Serviceable Obtainable Market | $٢.٠ million | Your realistic early share |
Basis of Sizing: Market sizing is based on the size of the fast-food market in the United States for 2026, focusing on the burger segment and determining a realistic market share for an independent restaurant.
Unit Economics
Measures the profitability of each sales unit/customer — the most accurate feasibility indicator:
| Unit Indicator | Value |
|---|---|
| Sales Unit | Dish |
| Average Price/Revenue per Unit | $١٥ |
| Customer Acquisition Cost (CAC) | $٨ |
| Customer Lifetime Value (LTV) | $٢٥٠ |
| LTV/CAC Ratio | ٣٣.٣× (Healthy) |
| Contribution Margin | ٦٨٪ |
Competitive Analysis
The US burger restaurant market is highly competitive, with major global chains like McDonald's and Burger King, as well as many independent restaurants. This project's sustainable advantage lies in offering high-quality burgers with fresh, local ingredients, an innovative menu that includes unique options, and an exceptional customer experience. The restaurant can also differentiate itself by focusing on sustainability practices and social responsibility.
Market Entry and Pricing Plan
The market entry plan involves targeting areas with high population density and good traffic. Marketing will be conducted through a combination of digital channels (social media, Google Ads, delivery apps) and local marketing (community partnerships, local events). Products will be priced competitively to offer excellent value to customers, with an average burger price of $14.72 USD.
Capacity and Operations
The restaurant is designed to accommodate 60-80 customers at a time, with an expected occupancy rate starting at 40% in the initial months and gradually increasing to 70-80% after the first year.
Daily operations focus on providing fast and efficient service while maintaining the highest standards of quality and hygiene. Staff will be trained in food preparation and customer service to professional standards. Strict procedures will be implemented to ensure food safety and inventory control to minimize waste.
Technical aspects include selecting a suitable, easily accessible location that provides ample space for the kitchen and dining area. Equipping the restaurant requires high-quality professional kitchen equipment ranging from $20,000 to $100,000, such as grills, fryers, refrigerators, and point-of-sale systems. Suppliers will be carefully selected to ensure the quality of fresh and local ingredients, with an emphasis on efficiency in the supply chain.
Projected Income Statement (5 Years)
| Item \ Year | Y1 | Y2 | Y3 | Y4 | Y5 |
|---|---|---|---|---|---|
| Revenues | $٨٠٠٬٠٠٠ | $٨٤٠٬٠٠٠ | $٨٨٢٬٠٠٠ | $٩٢٦٬١٠٠ | $٩٧٢٬٤٠٥ |
| Cost of Sales | ($٢٥٦٬٠٠٠) | ($٢٦٨٬٨٠٠) | ($٢٨٢٬٢٤٠) | ($٢٩٦٬٣٥٢) | ($٣١١٬١٧٠) |
| Gross Profit | $٥٤٤٬٠٠٠ | $٥٧١٬٢٠٠ | $٥٩٩٬٧٦٠ | $٦٢٩٬٧٤٨ | $٦٦١٬٢٣٥ |
| Operating Expenses | ($٤٤٠٬٠٠٠) | ($٤٦٢٬٠٠٠) | ($٤٨٥٬١٠٠) | ($٥٠٩٬٣٥٥) | ($٥٣٤٬٨٢٣) |
| EBITDA | $١٠٤٬٠٠٠ | $١٠٩٬٢٠٠ | $١١٤٬٦٦٠ | $١٢٠٬٣٩٣ | $١٢٦٬٤١٣ |
| Tax | ($٥٬١٠٠) | ($٥٬٨٨٠) | ($٦٬٦٩٩) | ($٧٬٥٥٩) | ($٨٬٤٦٢) |
| Net Profit | $٢٨٬٩٠٠ | $٣٣٬٣٢٠ | $٣٧٬٩٦١ | $٤٢٬٨٣٤ | $٤٧٬٩٥١ |
| Net Margin | ٤٪ | ٤٪ | ٤٪ | ٥٪ | ٥٪ |
Investment Cost Structure
| Item | Cost | Percentage |
|---|---|---|
| Kitchen Equipment and Fixtures | $١٠٥٬٠٠٠ | ٣٠٪ |
| Renovations and Interior Design | $٨٧٬٥٠٠ | ٢٥٪ |
| Initial Working Capital | $٧٠٬٠٠٠ | ٢٠٪ |
| Licenses and Permits | $٢٨٬٠٠٠ | ٨٪ |
| Rent and Insurance (Advance) | $٣٥٬٠٠٠ | ١٠٪ |
| Pre-opening Marketing | $٢٤٬٥٠٠ | ٧٪ |
Cash Flow and Breakeven Point
| Year | Operating Cash Flow | Cumulative Cash Flow |
|---|---|---|
| Year ١ | $٩٨٬٩٠٠ | -$٢٥١٬١٠٠ |
| Year ٢ | $١٠٣٬٣٢٠ | -$١٤٧٬٧٨٠ |
| Year ٣ | $١٠٧٬٩٦١ | -$٣٩٬٨١٩ |
| Year ٤ | $١١٢٬٨٣٤ | $٧٣٬٠١٥ |
| Year ٥ | $١١٧٬٩٥١ | $١٩٠٬٩٦٦ |
Estimated breakeven point at annual revenue ≈ $٧٥٠٬٠٠٠ (~٩٤٪ of first year revenue), with a contribution margin of ٦٨٪. Cumulative cash breakeven in Year ٤.
Funding Structure
| Funding Source | Percentage | Amount |
|---|---|---|
| Equity | ٦٠٪ | $٢١٠٬٠٠٠ |
| Debt Financing (١٢٪ interest) | ٤٠٪ | $١٤٠٬٠٠٠ |
Sensitivity Analysis (Revenue × Operations)
The impact of changes in revenue and costs together on Net Present Value:
| Revenue \ Operations | −10٪ | −5٪ | Base | +5٪ | +10٪ |
|---|---|---|---|---|---|
| −20٪ | $٢٠٩٬١٢٥ | $٩٦٬٢٢٩ | -$١٦٬٦٦٧ | -$١٣٧٬٤٩٠ | -$٢٧٠٬٣٠٩ |
| −10٪ | $٢٧٤٬٠٤٠ | $١٤٧٬٠٣٢ | $٢٠٬٠٢٤ | -$١١٠٬٩٢٧ | -$٢٦٠٬٣٤٧ |
| Base | $٣٣٨٬٩٥٦ | $١٩٧٬٨٣٦ | $٥٦٬٧١٦ | -$٨٥٬٥٧٠ | -$٢٥٠٬٣٨٦ |
| +10٪ | $٤٠٣٬٨٧١ | $٢٤٨٬٦٣٩ | $٩٣٬٤٠٧ | -$٦١٬٨٢٥ | -$٢٤٠٬٤٢٤ |
| +20٪ | $٤٦٨٬٧٨٦ | $٢٩٩٬٤٤٢ | $١٣٠٬٠٩٨ | -$٣٩٬٢٤٦ | -$٢٣٠٬٤٦٣ |
Scenario Analysis
| Scenario | Probability | NPV | Assessment |
|---|---|---|---|
| Pessimistic | ٢٥٪ | -$١٥٠٬٧٧٢ | Not feasible |
| Base | ٥٠٪ | $٥٦٬٧١٦ | Feasible |
| Optimistic | ٢٥٪ | $٣١٦٬٣٧٧ | Feasible |
Expected Present Value (Weighted): $٦٩٬٧٥٩.
Risk Analysis and Management
| Risk | Probability | Impact | Mitigation |
|---|---|---|---|
| Intense market competition | High | High | Differentiation in quality, innovation, and customer experience. |
| Rising ingredient costs (especially meat) | Medium | High | Diversify suppliers, negotiate prices, offer alternative menu options (vegetarian). |
| Difficulty attracting and retaining skilled employees | Medium | Medium | Offer competitive salaries and benefits, training and development programs, positive work environment. |
| Changes in consumer preferences towards healthier options | Medium | Medium | Include healthy and vegetarian options on the menu, market sustainable choices. |
| Regulatory challenges and health permits | Medium | High | Strict compliance with regulations, engage a specialized legal consultant in the food sector. |
Organizational Structure and Team
The organizational structure consists of a general manager, kitchen manager, customer service staff, and chefs. The general manager will oversee daily operations, marketing, and financial management. The kitchen manager will be responsible for food quality, chef training, and inventory management. Experienced personnel in the restaurant sector will be hired to ensure excellent service delivery.Legal and Regulatory Aspects
The project requires obtaining a set of licenses and permits, including a business license, food service permit, health and safety permits, signage permit, and alcohol sales license (if relevant). These requirements and costs vary by state and city in the United States.
Expansion and Sustainability Plan
Future expansion plans include opening additional branches in strategic locations, expanding the menu to include new and innovative options, and developing customer loyalty programs. Franchise models can also be explored as a long-term expansion option.
Environmental, Social, and Governance (ESG) Impact
The project aims to reduce environmental impact by using local ingredients to reduce carbon emissions associated with transportation. Emphasis will be placed on reducing food waste, recycling waste, and using eco-friendly packaging. Options for sustainable meat and plant-based alternatives can also be explored to reduce the carbon footprint of burgers.
Conclusions and Recommendations
The burger restaurant project in the United States has significant growth potential amidst continuous demand for fast food. By focusing on quality, innovation, and a unique customer experience, the project can achieve profitability and success in this competitive market. It is recommended to conduct a detailed feasibility study for the specific location before commencing implementation.
Frequently Asked Questions
How much does it cost to open a burger restaurant in the United States?
The cost of opening an independent burger restaurant in the United States ranges from $95,000 to $750,000, with an average of about $275,000 for a medium-sized restaurant.
What is the average revenue for a burger restaurant in its first year?
A well-performing independent burger restaurant can generate approximately $800,000 in revenue in its first year, considering the average sales of independent restaurants.
What is the expected profit margin for a burger restaurant?
The average net profit margin for an independent burger restaurant in the United States ranges from 10% to 15% once established.
What are the essential licenses required for a burger restaurant in the United States?
Essential licenses include a business license, food service permit, health and safety permits, signage permit, and some restaurants may require an alcohol sales license.
Is a burger restaurant project profitable in the United States?
Yes, a burger restaurant project can be very profitable in the United States, given the global demand for burgers, menu diversity, and ease of preparation, but success requires careful planning and effective management.
Sources and Disclaimer
- US Fast Food Market Reports for 2026 (Grand View Research, IMARC Group, Renub Research)
- Average Restaurant Startup and Operating Cost Data in the US (StartupCostHub, JIM, Toast POS)
- Profit Margin and Cost of Sales Analyses in the Burger Sector (SocCash)
- Average Burger Prices in the US (Toast POS, Burger Price Index)
- Interest Rates and Small Business Loans in the US (Bankrate, GoKapital)
Disclaimer: This is a guiding study that provides financial analysis according to approved industry standards; verify figures locally according to your project's reality before any investment decision.