Executive Summary
The project Biochar Production Project from Agricultural Waste to Improve Soil Quality and Reduce Carbon Emissions in Syria. The project relies on converting available agricultural waste in the energy and environment sector in Syria targets a promising market opportunity. With an investment of ٦٥٠٬٠٠٠٬٠٠٠ SYP, it achieves a Net Present Value (NPV) of ٩٢٢٬٨٨١٬٤٠٥ SYP, an Internal Rate of Return (IRR) of ٥٥٪, and a payback period of 1.8 years.
| Indicator | Value |
|---|---|
| Initial Investment | ٦٥٠٬٠٠٠٬٠٠٠ SYP |
| First Year Revenue | ١٬٢٠٠٬٠٠٠٬٠٠٠ SYP |
| Annual Growth (CAGR) | ١٥٪ |
| Net Margin (Y1) | ١٧٪ |
| Return on Investment (Avg.) | ٤٩٪ annually |
| Net Present Value (NPV) | ٩٢٢٬٨٨١٬٤٠٥ SYP |
| Internal Rate of Return (IRR) | ٥٥٪ |
| Profitability Index (PI) | ٢ |
| Payback Period | ٢ years |
| Break-even Year | Year ٢ |
| Expected NPV (Probability-Weighted) | ٩٣٨٬١٤١٬٥٩٨ SYP |
Assumptions and Basis
The figures in this study are based on project data, the nature of the energy and environment sector in Syria, and local market indicators, according to the following assumptions:
| Assumption | Value |
|---|---|
| Initial Capital | ٦٥٠٬٠٠٠٬٠٠٠ SYP |
| First Year Revenue | ١٬٢٠٠٬٠٠٠٬٠٠٠ SYP |
| Annual Growth | ١٥٪ |
| Cost of Goods Sold (COGS) | ٤٠٪ of Revenue |
| Operating Expenses | ٣٠٪ of Revenue |
| Tax/Zakat | ١٠٪ |
| Discount Rate (WACC) | ١٢٪ |
| Study Horizon | ٥ years |
Basis of Assumptions: Current market prices and economic rates in Syria
Project Description and Opportunity
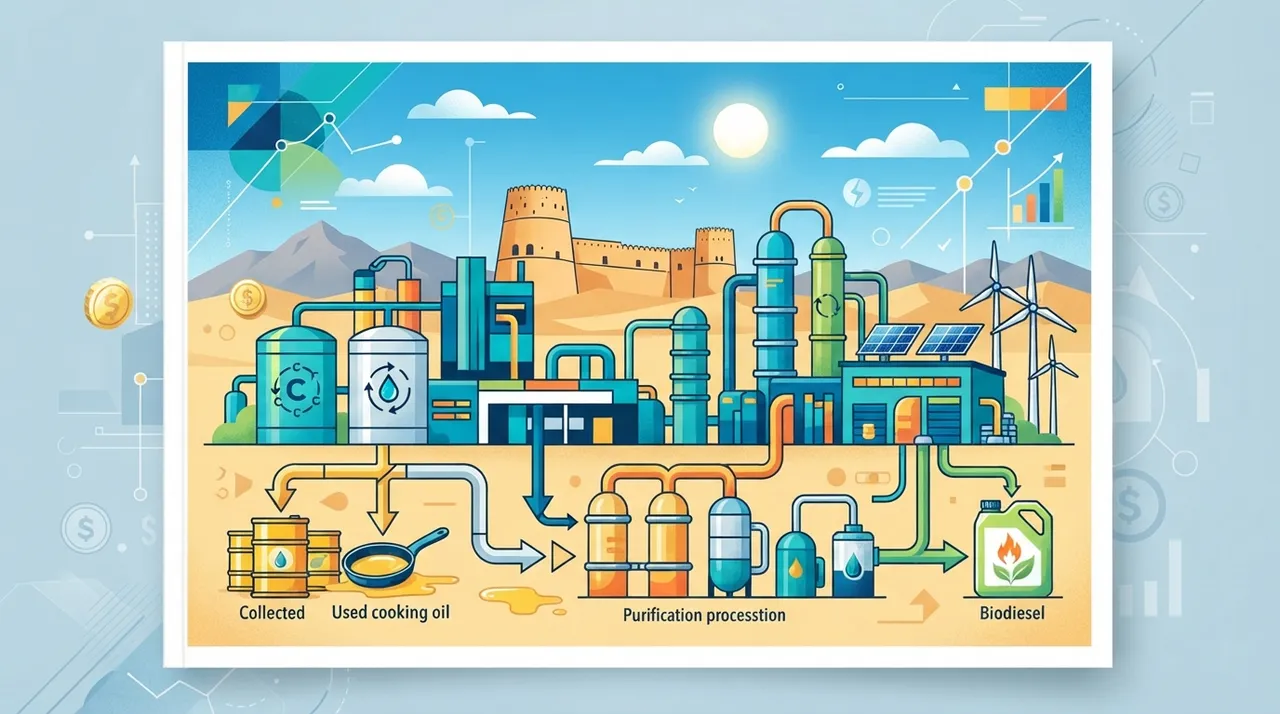
The project focuses on converting agricultural waste into biochar to improve soil quality and reduce carbon emissions. The goal is to meet local and international demand for biochar.
Market and Demand Study
The Syrian market is considered promising for biochar due to the need for improving soil quality and reducing carbon emissions.
Market Sizing (TAM / SAM / SOM)
Market sizing methodology was used based on market studies and economic forecasts.
| Level | Annual Size | Description |
|---|---|---|
| TAM — Total Addressable Market | 10000.0 million SYP | Total serviceable demand |
| SAM — Serviceable Available Market | 5000.0 million SYP | The portion your model reaches |
| SOM — Serviceable Obtainable Market | 2000.0 million SYP | Your realistic early share |
Basis of Sizing: Market studies and economic forecasts
Unit Economics
Measures the profitability of each sales unit/customer — the most accurate feasibility indicator:
| Unit Indicator | Value |
|---|---|
| Sales Unit | ton |
| Average Price/Revenue per Unit | ١٥٠٬٠٠٠ SYP |
| Customer Acquisition Cost (CAC) | ٢٠٬٠٠٠ SYP |
| Customer Lifetime Value (LTV) | ٥٠٠٬٠٠٠ SYP |
| LTV/CAC Ratio | ٢٥× (healthy) |
| Contribution Margin | ٦٠٪ |
Competitive Analysis
Competition in the Syrian biochar market is not high, providing an opportunity for the project to achieve a significant market share.
Market Entry and Pricing Strategy
The market entry and marketing plan will focus on building relationships with farmers and end-users of biochar.
Capacity and Operations
The expected production capacity is 10000 tons in the first year.
Daily operation of the project will require a team of skilled workers in production and manufacturing.
The technical aspects of the project will rely on using modern technology to convert agricultural waste into biochar.
Projected Income Statement (٥ Years)
| Item \ Year | Y1 | Y2 | Y3 | Y4 | Y5 |
|---|---|---|---|---|---|
| Revenues | ١٬٢٠٠٬٠٠٠٬٠٠٠ SYP | ١٬٣٨٠٬٠٠٠٬٠٠٠ SYP | ١٬٥٨٧٬٠٠٠٬٠٠٠ SYP | ١٬٨٢٥٬٠٥٠٬٠٠٠ SYP | ٢٬٠٩٨٬٨٠٧٬٥٠٠ SYP |
| Cost of Sales | (٤٨٠٬٠٠٠٬٠٠٠ SYP) | (٥٥٢٬٠٠٠٬٠٠٠ SYP) | (٦٣٤٬٨٠٠٬٠٠٠ SYP) | (٧٣٠٬٠٢٠٬٠٠٠ SYP) | (٨٣٩٬٥٢٣٬٠٠٠ SYP) |
| Gross Profit | ٧٢٠٬٠٠٠٬٠٠٠ SYP | ٨٢٨٬٠٠٠٬٠٠٠ SYP | ٩٥٢٬٢٠٠٬٠٠٠ SYP | ١٬٠٩٥٬٠٣٠٬٠٠٠ SYP | ١٬٢٥٩٬٢٨٤٬٥٠٠ SYP |
| Operating Expenses | (٣٦٠٬٠٠٠٬٠٠٠ SYP) | (٤١٤٬٠٠٠٬٠٠٠ SYP) | (٤٧٦٬١٠٠٬٠٠٠ SYP) | (٥٤٧٬٥١٥٬٠٠٠ SYP) | (٦٢٩٬٦٤٢٬٢٥٠ SYP) |
| EBITDA | ٣٦٠٬٠٠٠٬٠٠٠ SYP | ٤١٤٬٠٠٠٬٠٠٠ SYP | ٤٧٦٬١٠٠٬٠٠٠ SYP | ٥٤٧٬٥١٥٬٠٠٠ SYP | ٦٢٩٬٦٤٢٬٢٥٠ SYP |
| Tax | (٢٣٬٠٠٠٬٠٠٠ SYP) | (٢٨٬٤٠٠٬٠٠٠ SYP) | (٣٤٬٦١٠٬٠٠٠ SYP) | (٤١٬٧٥١٬٥٠٠ SYP) | (٤٩٬٩٦٤٬٢٢٥ SYP) |
| Net Profit | ٢٠٧٬٠٠٠٬٠٠٠ SYP | ٢٥٥٬٦٠٠٬٠٠٠ SYP | ٣١١٬٤٩٠٬٠٠٠ SYP | ٣٧٥٬٧٦٣٬٥٠٠ SYP | ٤٤٩٬٦٧٨٬٠٢٥ SYP |
| Net Margin | ١٧٪ | ١٩٪ | ٢٠٪ | ٢١٪ | ٢١٪ |
Investment Cost Structure
| Item | Cost | Percentage |
|---|---|---|
| Production Cost | ٢٦٠٬٠٠٠٬٠٠٠ SYP | ٤٠٪ |
| Marketing Cost | ١٣٠٬٠٠٠٬٠٠٠ SYP | ٢٠٪ |
| Labor Cost | ٩٧٬٥٠٠٬٠٠٠ SYP | ١٥٪ |
| Material Cost | ٦٥٬٠٠٠٬٠٠٠ SYP | ١٠٪ |
| Other Cost | ٩٧٬٥٠٠٬٠٠٠ SYP | ١٥٪ |
Cash Flow and Break-even Point
| Year | Operating Cash Flow | Cumulative Cash Flow |
|---|---|---|
| Year ١ | ٣٣٧٬٠٠٠٬٠٠٠ SYP | -٣١٣٬٠٠٠٬٠٠٠ SYP |
| Year ٢ | ٣٨٥٬٦٠٠٬٠٠٠ SYP | ٧٢٬٦٠٠٬٠٠٠ SYP |
| Year ٣ | ٤٤١٬٤٩٠٬٠٠٠ SYP | ٥١٤٬٠٩٠٬٠٠٠ SYP |
| Year ٤ | ٥٠٥٬٧٦٣٬٥٠٠ SYP | ١٬٠١٩٬٨٥٣٬٥٠٠ SYP |
| Year ٥ | ٥٧٩٬٦٧٨٬٠٢٥ SYP | ١٬٥٩٩٬٥٣١٬٥٢٥ SYP |
Estimated break-even point at annual revenue ≈ ٨١٦٬٦٦٦٬٦٦٧ SYP (~٦٨٪ of first year revenue), with a contribution margin of ٦٠٪. Cumulative cash break-even in Year ٢.
Funding Structure
| Funding Source | Percentage | Amount |
|---|---|---|
| Equity | ٦٠٪ | ٣٩٠٬٠٠٠٬٠٠٠ SYP |
| Debt Financing (٨٪ interest) | ٤٠٪ | ٢٦٠٬٠٠٠٬٠٠٠ SYP |
Sensitivity Analysis (Revenue × Operations)
Impact of simultaneous changes in revenue and costs on Net Present Value:
| Revenue \ Operations | −10٪ | −5٪ | Base | +5٪ | +10٪ |
|---|---|---|---|---|---|
| −20٪ | ١٬٠٢٤٬٦١٦٬٠٢٦ SYP | ٨٢١٬١٤٦٬٧٨٤ SYP | ٦١٧٬٦٧٧٬٥٤٢ SYP | ٤١٤٬٢٠٨٬٣٠٠ SYP | ٢١٠٬٧٣٩٬٠٥٨ SYP |
| −10٪ | ١٬٢٢٨٬٠٨٥٬٢٦٧ SYP | ٩٩٩٬١٨٢٬٣٧٠ SYP | ٧٧٠٬٢٧٩٬٤٧٣ SYP | ٥٤١٬٣٧٦٬٥٧٦ SYP | ٣١٢٬٤٧٣٬٦٧٩ SYP |
| Base | ١٬٤٣١٬٥٥٤٬٥٠٩ SYP | ١٬١٧٧٬٢١٧٬٩٥٧ SYP | ٩٢٢٬٨٨١٬٤٠٥ SYP | ٦٦٨٬٥٤٤٬٨٥٢ SYP | ٤١٤٬٢٠٨٬٣٠٠ SYP |
| +10٪ | ١٬٦٣٥٬٠٢٣٬٧٥١ SYP | ١٬٣٥٥٬٢٥٣٬٥٤٤ SYP | ١٬٠٧٥٬٤٨٣٬٣٣٦ SYP | ٧٩٥٬٧١٣٬١٢٨ SYP | ٥١٥٬٩٤٢٬٩٢١ SYP |
| +20٪ | ١٬٨٣٨٬٤٩٢٬٩٩٣ SYP | ١٬٥٣٣٬٢٨٩٬١٣٠ SYP | ١٬٢٢٨٬٠٨٥٬٢٦٧ SYP | ٩٢٢٬٨٨١٬٤٠٥ SYP | ٦١٧٬٦٧٧٬٥٤٢ SYP |
Scenario Analysis
| Scenario | Probability | NPV | Assessment |
|---|---|---|---|
| Pessimistic | ٢٥٪ | ٤٩٥٬٥٩٥٬٩٩٧ SYP | Feasible |
| Base | ٥٠٪ | ٩٢٢٬٨٨١٬٤٠٥ SYP | Feasible |
| Optimistic | ٢٥٪ | ١٬٤١١٬٢٠٧٬٥٨٥ SYP | Feasible |
Expected Present Value (Weighted): ٩٣٨٬١٤١٬٥٩٨ SYP.
Risk Analysis and Management
| Risk | Probability | Impact | Mitigation |
|---|---|---|---|
| Risk of insufficient demand | Low | High | Increase marketing |
| Risk of increased costs | Medium | Medium | Improve efficiency |
| Risk of policy changes | Low | High | Monitor changes |
| Risk of insufficient resources | Medium | Medium | Improve management |
Organizational Structure and Team
The project's organizational structure will consist of a management team, production workers, and manufacturing workers.
Legal and Regulatory Aspects
The project will require obtaining the necessary licenses from Syrian authorities.
Expansion and Sustainability Plan
Growth and expansion will require increasing production and improving quality.
Environmental, Social, and Governance (ESG) Impact
The environmental impact of the project will be positive due to reduced carbon emissions.
Conclusions and Recommendations
The conclusion is that the project is considered a profitable and promising venture in the Syrian market.
Frequently Asked Questions
How much does it cost to produce a ton of biochar?
150000 SYP
How much profit does the project make in the first year?
1200000000 SYP
What licenses are required for the project?
Licenses from the Ministry of Agriculture and the Ministry of Industry
Is the biochar production project profitable in Syria?
Yes
How many workers are in the project?
50 workers
Sources and Disclaimer
- Market studies
- Economic forecasts
- Industry reports
Disclaimer: This is a guiding study that provides financial analysis according to approved industry standards; verify the figures locally according to your project's reality before any investment decision.