Executive Summary
The paper and cardboard recycling project in the U.S. energy and environment sector targets a promising market opportunity. With an investment of $150,000, it achieves a net present value (NPV) of -$33,344, an internal rate of return (IRR) of 1%, and a payback period of 4.8 years.
| Indicator | Value |
|---|---|
| Initial Investment | $150,000 |
| First-Year Revenue | $180,000 |
| Annual Growth (CAGR) | 8% |
| Net Margin (Y1) | -2% |
| Return on Investment (Avg) | 1% annually |
| Net Present Value (NPV) | -$33,344 |
| Internal Rate of Return (IRR) | 1% |
| Profitability Index (PI) | 1 |
| Payback Period | 5 years |
| Breakeven Year | Year 5 |
| Expected NPV (Probability-Weighted) | -$33,109 |
Assumptions and Basis
The figures in this study are based on project data, the nature of the energy and environment sector in the United States, and local market indicators, according to the following assumptions:
| Assumption | Value |
|---|---|
| Initial Capital | $150,000 |
| First-Year Revenue | $180,000 |
| Annual Growth | 8% |
| Cost of Goods Sold (COGS) | 55% of Revenue |
| Operating Expenses | 30% of Revenue |
| Tax/Zakat | 21% |
| Discount Rate (WACC) | 10% |
| Study Horizon | 5 years |
Basis of Assumptions: These figures are based on the average operating costs and projected revenues for small to medium-sized recycling facilities in the United States, taking into account current market prices for recycled materials and labor and energy costs.
Project Description and Opportunity
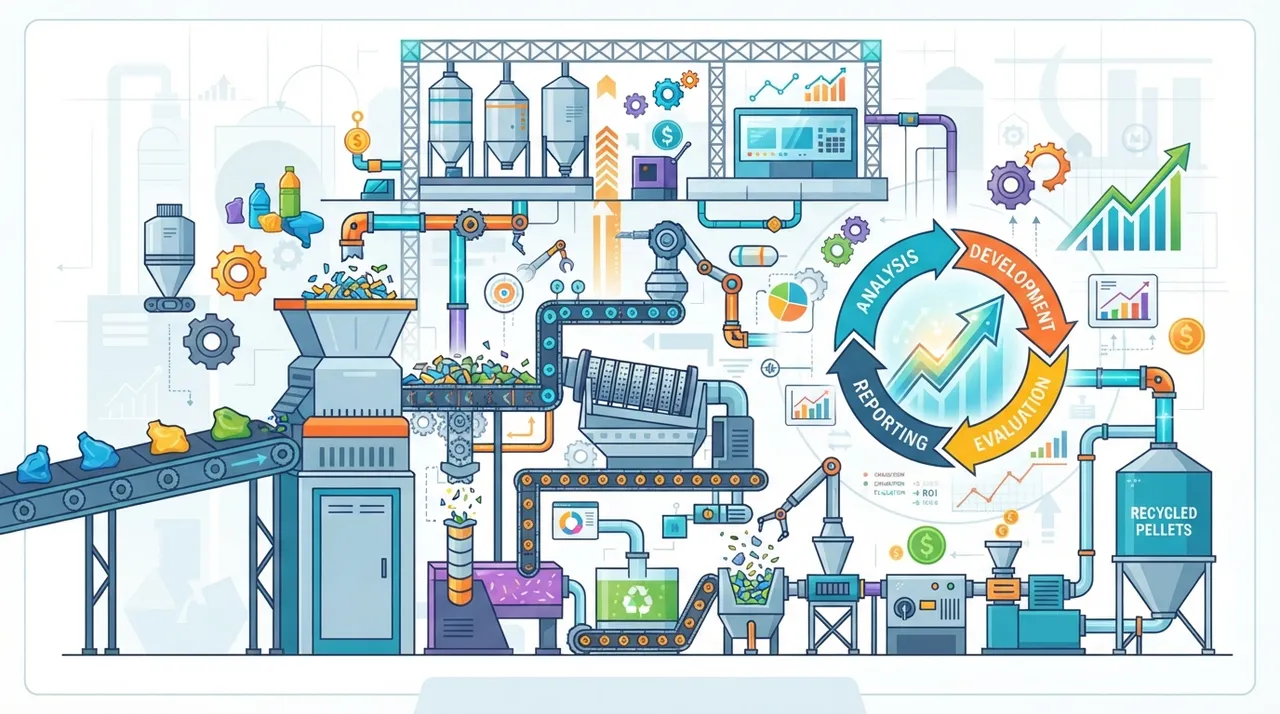
The paper and cardboard recycling project aims to process paper waste and convert it into valuable raw materials that can be reused in various industries. This opportunity is considered profitable in the United States due to the increasing focus on sustainability and the demand for recycled materials. The business model relies on collecting paper and cardboard from businesses, institutions, and collection centers, then sorting, cleaning, and baling it for sale to factories. The target customer includes paper and cardboard factories that use recycled materials in their production processes, as well as companies seeking to dispose of their paper waste in an environmentally friendly manner.
Market and Demand Study
The paper and cardboard recycling market in the United States is experiencing continuous growth driven by environmental regulations and increasing awareness of sustainability among consumers and businesses. The rise of e-commerce contributes to the growing volume of cardboard waste, creating significant demand for recycling services. Additionally, the rising costs of virgin raw materials push manufacturers towards using recycled materials, which boosts demand for the project's products. The United States is one of the largest producers and consumers of paper and cardboard, providing a large and stable market for recycling projects.
Market Sizing (TAM / SAM / SOM)
The market was qualitatively sized by analyzing the volume of paper and cardboard production and consumption in the United States, and estimating the proportion of recyclable materials from these quantities. The growth of the e-commerce sector and its impact on cardboard waste volume were also taken into account. The project's production capacity and projected market share were estimated based on the proposed investment size and the equipment used. Demand from factories using recycled materials and current purchase prices for these materials in the market were also evaluated.
| Level | Annual Size | Description |
|---|---|---|
| TAM — Total Addressable Market | $25,000.0 million | Total serviceable demand |
| SAM — Serviceable Available Market | $7,500.0 million | The segment your model reaches |
| SOM — Serviceable Obtainable Market | $75.0 million | Your realistic early share |
Sizing Basis: The Total Addressable Market (TAM) was determined based on the total annual value of the paper and cardboard market in the United States. The Serviceable Available Market (SAM) was estimated at 30% of TAM, considering the potential share for recycling. The Serviceable Obtainable Market (SOM) was estimated at 1% of SAM, based on the initial project size and competitiveness.
Unit Economics
Measures the profitability of each sales unit/customer — the most accurate feasibility indicator:
| Unit Indicator | Value |
|---|---|
| Sales Unit | ton |
| Avg. Price/Revenue per Unit | $150 |
| Customer Acquisition Cost (CAC) | $50 |
| Customer Lifetime Value (LTV) | $1,500 |
| LTV/CAC Ratio | 30x (healthy) |
| Contribution Margin | 45% |
Competitive Analysis
Current competitors include large recycling companies and small collection facilities. The challenge lies in competing for raw materials at competitive prices. The project's sustainable advantage is characterized by the high quality of recycled materials, excellent customer service, and long-term contracts with suppliers and buyers. A competitive advantage can also be achieved by investing in modern technology that increases sorting and processing efficiency, and by offering customized solutions for large companies to manage their paper waste.
Go-to-Market Strategy and Pricing
The go-to-market strategy relies on building strong relationships with businesses and institutions to secure stable sources of paper and cardboard. Marketing will be conducted through direct channels such as sales representatives, and digital channels such as email marketing campaigns and social media. Content marketing can be used to educate customers about the benefits of recycling. Pricing will be determined based on current market prices for recycled paper and cardboard, with incentives offered for large quantities and long-term contracts. Consulting services for waste management can also be offered to companies to strengthen partnerships.
Capacity and Operations
The project's production capacity begins with processing 1,000 tons per month in the first year, with a gradual increase of 15% annually to meet growing demand and improve operational efficiency. Occupancy is expected to reach 70% in the first year and 90% by the third year.
Daily operations involve collecting paper and cardboard from suppliers, sorting it by type and quality, then baling and storing it before shipment. Emphasis is placed on ensuring the quality of incoming raw materials and the final product. Strict quality control procedures are applied at every stage of the process. The team is trained in best practices for material handling, equipment maintenance, and adherence to safety standards. Inventory management systems are used to track incoming and outgoing materials and optimize storage efficiency.
Technical aspects of the project include selecting a suitable location near large paper and cardboard sources and major transportation networks. The site must have sufficient space for storage, sorting, and baling. Essential equipment includes sorting machines, cardboard balers, forklifts, and transportation equipment. Key suppliers are businesses and institutions that generate large quantities of paper waste, and maintenance companies for equipment. Strict environmental and health standards must be adhered to to ensure operational safety and final product quality.
Projected Income Statement (5 Years)
| Item \ Year | Y1 | Y2 | Y3 | Y4 | Y5 |
|---|---|---|---|---|---|
| Revenue | $180,000 | $194,400 | $209,952 | $226,748 | $244,888 |
| Cost of Sales | ($99,000) | ($106,920) | ($115,474) | ($124,711) | ($134,688) |
| Gross Profit | $81,000 | $87,480 | $94,478 | $102,037 | $110,200 |
| Operating Expenses | ($54,000) | ($58,320) | ($62,986) | ($68,024) | ($73,466) |
| EBITDA | $27,000 | $29,160 | $31,493 | $34,012 | $36,733 |
| Tax | ($0) | ($0) | ($313) | ($843) | ($1,414) |
| Net Profit | -$3,000 | -$840 | $1,179 | $3,170 | $5,319 |
| Net Margin | -2% | -0% | 1% | 1% | 2% |
Investment Cost Structure
| Item | Cost | Percentage |
|---|---|---|
| Equipment Purchase and Setup | $60,000 | 40% |
| Initial Operating Costs (Rent, Utilities) | $30,000 | 20% |
| Initial Labor Costs | $22,500 | 15% |
| Marketing and Relationship Building | $15,000 | 10% |
| Legal Fees and Licenses | $15,000 | 10% |
| Emergency Working Capital | $7,500 | 5% |
Cash Flow and Breakeven Point
| Year | Operating Cash Flow | Cumulative Cash Flow |
|---|---|---|
| Year 1 | $27,000 | -$123,000 |
| Year 2 | $29,160 | -$93,840 |
| Year 3 | $31,179 | -$62,661 |
| Year 4 | $33,170 | -$29,491 |
| Year 5 | $35,319 | $5,828 |
Estimated breakeven point at annual revenue ≈ $186,667 (~104% of first-year revenue), with a 45% contribution margin. Cumulative cash breakeven in Year 5.
Funding Structure
| Funding Source | Percentage | Amount |
|---|---|---|
| Equity | 70% | $105,000 |
| Debt Financing (8% interest) | 30% | $45,000 |
Sensitivity Analysis (Revenue × Operations)
Impact of combined changes in revenue and costs on Net Present Value:
| Revenue \ Operations | −10% | −5% | Base | +5% | +10% |
|---|---|---|---|---|---|
| −20% | -$1,461 | -$26,622 | -$55,324 | -$86,883 | -$118,441 |
| −10% | $14,121 | -$13,927 | -$43,976 | -$78,993 | -$114,497 |
| Base | $29,703 | -$1,461 | -$33,344 | -$71,103 | -$110,552 |
| +10% | $45,285 | $11,004 | -$23,334 | -$63,214 | -$106,607 |
| +20% | $60,867 | $23,470 | -$13,927 | -$55,324 | -$102,662 |
Scenario Analysis
| Scenario | Probability | NPV | Assessment |
|---|---|---|---|
| Pessimistic | 25% | -$74,259 | Not Feasible |
| Base | 50% | -$33,344 | Not Feasible |
| Optimistic | 25% | $8,511 | Feasible |
Expected Present Value (Weighted): -$33,109.
Risk Analysis and Management
| Risk | Probability | Impact | Mitigation |
|---|---|---|---|
| Fluctuations in recycled material prices | Medium | High | Long-term contracts with buyers, diversification of revenue sources. |
| Difficulty in obtaining sufficient raw materials | Medium | High | Building strong relationships with multiple suppliers, seeking new collection areas. |
| Changes or tightening of environmental regulations | Low | Medium | Monitoring legislative updates, adhering to the highest environmental standards. |
| Equipment failure or technical malfunctions | Medium | Medium | Regular maintenance, spare parts provision, emergency plan for alternative equipment. |
| Intense market competition | Medium | Medium | Focus on quality, excellent customer service, specialization in specific types of paper. |
Organizational Structure and Team
The proposed organizational structure consists of a Project Manager, responsible for overall operational oversight, an Operations Manager responsible for daily operational aspects, and a team of skilled workers for sorting, baling, and maintenance. Managers should have experience in the recycling or waste management sector. Continuous training programs will be provided to workers to enhance their skills and ensure adherence to safety and quality standards.
Legal and Regulatory Aspects
The project requires obtaining environmental permits from the Environmental Protection Agency (EPA) at both federal and state levels, in addition to local operating licenses. All regulations related to waste management, classification, and transportation must be adhered to. Necessary building permits for the facility must also be obtained. It is recommended to consult with a lawyer specializing in environmental law to ensure compliance with all legal and regulatory requirements in the United States.
Expansion and Sustainability Plan
The project can be expanded by gradually increasing production capacity, or by expanding into new geographic areas to cover more paper and cardboard sources. Other types of recyclable materials, such as plastic or glass, can also be added to increase revenue and diversify income sources. Strategic partnerships can be built with large waste management companies or factories to ensure a continuous flow of raw materials and customers.
Environmental, Social, and Governance (ESG) Impact
The project contributes positively to the environment by reducing the volume of waste sent to landfills, and by saving energy and natural resources that would have been used in producing new materials. It also reduces greenhouse gas emissions associated with virgin paper production. On the social front, the project provides local employment opportunities and promotes environmental awareness. The project is committed to good governance principles through transparency, accountability, and adherence to ethical standards in all operations.
Conclusions and Recommendations
Based on the analysis, the paper and cardboard recycling project in the United States is economically and environmentally feasible. There is a large market and increasing demand for recycled materials, providing good growth opportunities. Investment in this project is recommended, with a focus on operational efficiency, quality, and building strong relationships with suppliers and customers to ensure long-term success.
Frequently Asked Questions
How much does it cost to set up a paper and cardboard recycling project in the United States?
The initial investment cost for a paper and cardboard recycling project in the United States is approximately $150,000 for a small to medium-sized project.
What is the expected average revenue for a paper and cardboard recycling project?
The average annual revenue in the first year is expected to be approximately $180,000, with an annual growth rate of 8%.
Is a paper recycling project profitable in the United States?
Yes, a paper and cardboard recycling project is considered profitable in the United States due to increasing demand for recycled materials and supportive environmental legislation.
What licenses are required for a paper recycling project in the United States?
The project requires environmental permits from the Environmental Protection Agency (EPA) at both federal and state levels, in addition to local operating licenses and building permits.
What is the market size for paper recycling in the United States?
The Serviceable Available Market (SAM) for paper and cardboard recycling in the United States is estimated at approximately $7.5 billion annually.
Sources and Disclaimer
- U.S. recycling industry reports (e.g., from the Institute of Scrap Recycling Industries (ISRI))
- Commodity price data for recycled materials
- Market studies and industry analyses for the waste management sector
- U.S. Environmental Protection Agency (EPA) statistics on waste generation and recycling
- Government websites and regulatory agencies for licensing requirements
Disclaimer: This is a guiding study that provides financial analysis according to accepted industry standards; verify figures locally according to your project's reality before any investment decision.